
We’re always improving our test procedures at Solid Signal and starting with the latest crop of antennas, we’re giving you even more tools to try to choose the best antenna for you.
As much as I’d like it, the budget just doesn’t include $100k for a proper anechoic chamber and test gear, so I’m doing the next best thing – instrumented real world testing. The result tells you how well all our antennas perform at exactly the same spot so you can get an idea which one is best for you. And, I’ve added a new testing dimension to help you understand what channels you will really get.
I start with the same spectrum analyzer used by one of the world’s leading test facilities – the Televes H45. This meter gives all the details of a signal, not just raw power. See, raw power measurements can be faked with a cheap amplifier. This new analyzer gives me the power to really tell what channels will come in, because it actually tunes every channel and makes the most important measurement of all — signal to noise ratio. Let’s take a look.
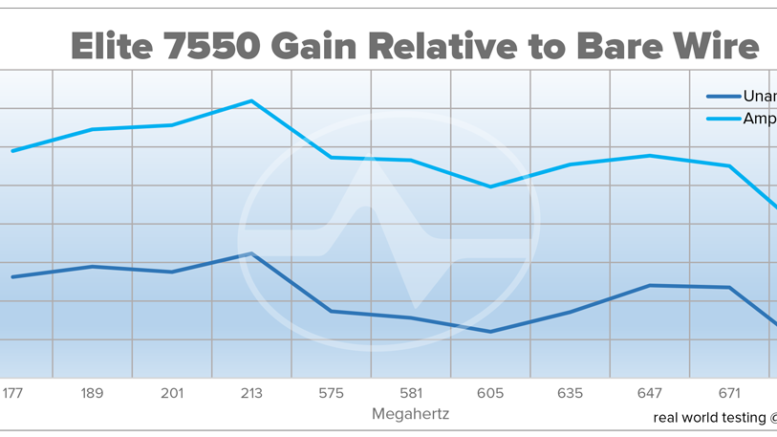
Chart 1: Gain
When testing an antenna, we start with measurements “on the day of” of a 3′ length of bare wire, placed at the same height as the antenna would be, horizontally arranged into a simple dipole. While this isn’t as good as a real reference dipole, it’s a good start. A reference dipole would be the exact length needed to receive a specific frequency.
All measurements are done in our West Coast Operations Center about 60 miles away from Mt. Wilson, California.
Then, we measure the antenna in the same spot. If the cloud cover has changed, we start over. The Televes spectrum analyzer takes four measurements of each channel between 2 and 51: signal strength, Bit Error Rate, Carrier-to-noise ratio, and Signal-to-noise ratio. The results are transferred to a PC for analysis.
If an antenna has an amplifier, it is tested with the amplifier both powered and unpowered. Then, the data from the bare wire is subtracted from the signal strength measurements. That’s the result you see in the top chart.
In this case you see that the Winegard Elite 7550 offers between 10dB more and 12dB less signal than bare wire when it’s not amplified. That’s not terribly good. Luckily the antenna has a nice strong amplifier and so you see 20-40dB more signal with the amplifier active. However, you do see signal strengths dipping up toward high frequencies, so if you’re trying to get a signal from UHF channel 51 this might not be the right one for you. However, it is very strong in the 170-220MHz VHF range (Channels 7-13) so if that’s most important then you’ll want to take a closer look.

Chart 2: Amplifier Gain
This is a simple measurement of the difference between the signal strength with the amplifier plugged in or unplugged. Ideally you would want a nice straight line, but this one isn’t so bad. The gain of 35dB is a little on the high side but it’s going to let you split the signal up to 8 times without worrying at all about long cable runs.
What you want to look for here is that the line doesn’t dip sharply as it moves right. This would be a sign that the amplifier isn’t properly accounting for “slope.” Slope isn’t usually a problem with antennas, but it’s true that all amplifiers are less effective as frequencies get higher. Most amplifiers will actually put more power into high frequencies to compensate for this. In this chart we see that the gain at 177MHz and the gain at 677MHz are about the same so there’s nothing to worry about.

Chart 3: Signal to Noise Ratio
This is actually the most important chart. Digital signals only work well when there is about 100x more signal than noise. Below that you tend to get weird stuff on screen or the picture freezes. So you can take a really weak signal and amplify it like crazy, but if the signal starts out too weak it won’t lock on. This is the chart you really care about.
You want to count the number of channels where the signal-to-noise ratio (SNR) is above 20. An SNR of 20 means that you’ll have good results most of the time. An SNR of 30 is awesome and means you’ll hardly ever worry about losing reception.
In the chart above you see that without the amplifier, only 6 channels are above 20. When amplified, you see 20 channels in that “good” range. At 60 miles, that’s not bad!
What did we learn?
By testing gain and SNR, we can show how an antenna will perform when you hook it up. Just testing gain and doing a channel scan on a TV is a reasonable way to test but this is more scientific and gives you charts that can help you understand how different antennas perform.
In this case we learned that this Winegard antenna will work without an amplifier, but you wouldn’t want to use it that way unless you are much closer to the towers. In fact unless you’re more than 20 miles away you might want to leave the amplifier unplugged because power levels might be too high when amplified.
We also learned that this antenna is not very strong at the high end of the broadcast range, so if you need to pick up channel 49, 50, or 51, you probably want to choose something else.
Be the first to comment on "How to read Solid Signal’s new test charts"